The fleet view is the whole product on one screen. Node bands across the top, server cards beneath them, an identity strip that says whether what you are looking at is current. It is designed to be parked on a second monitor and read in a glance rather than studied, so most of this page is about what a glance should tell you.
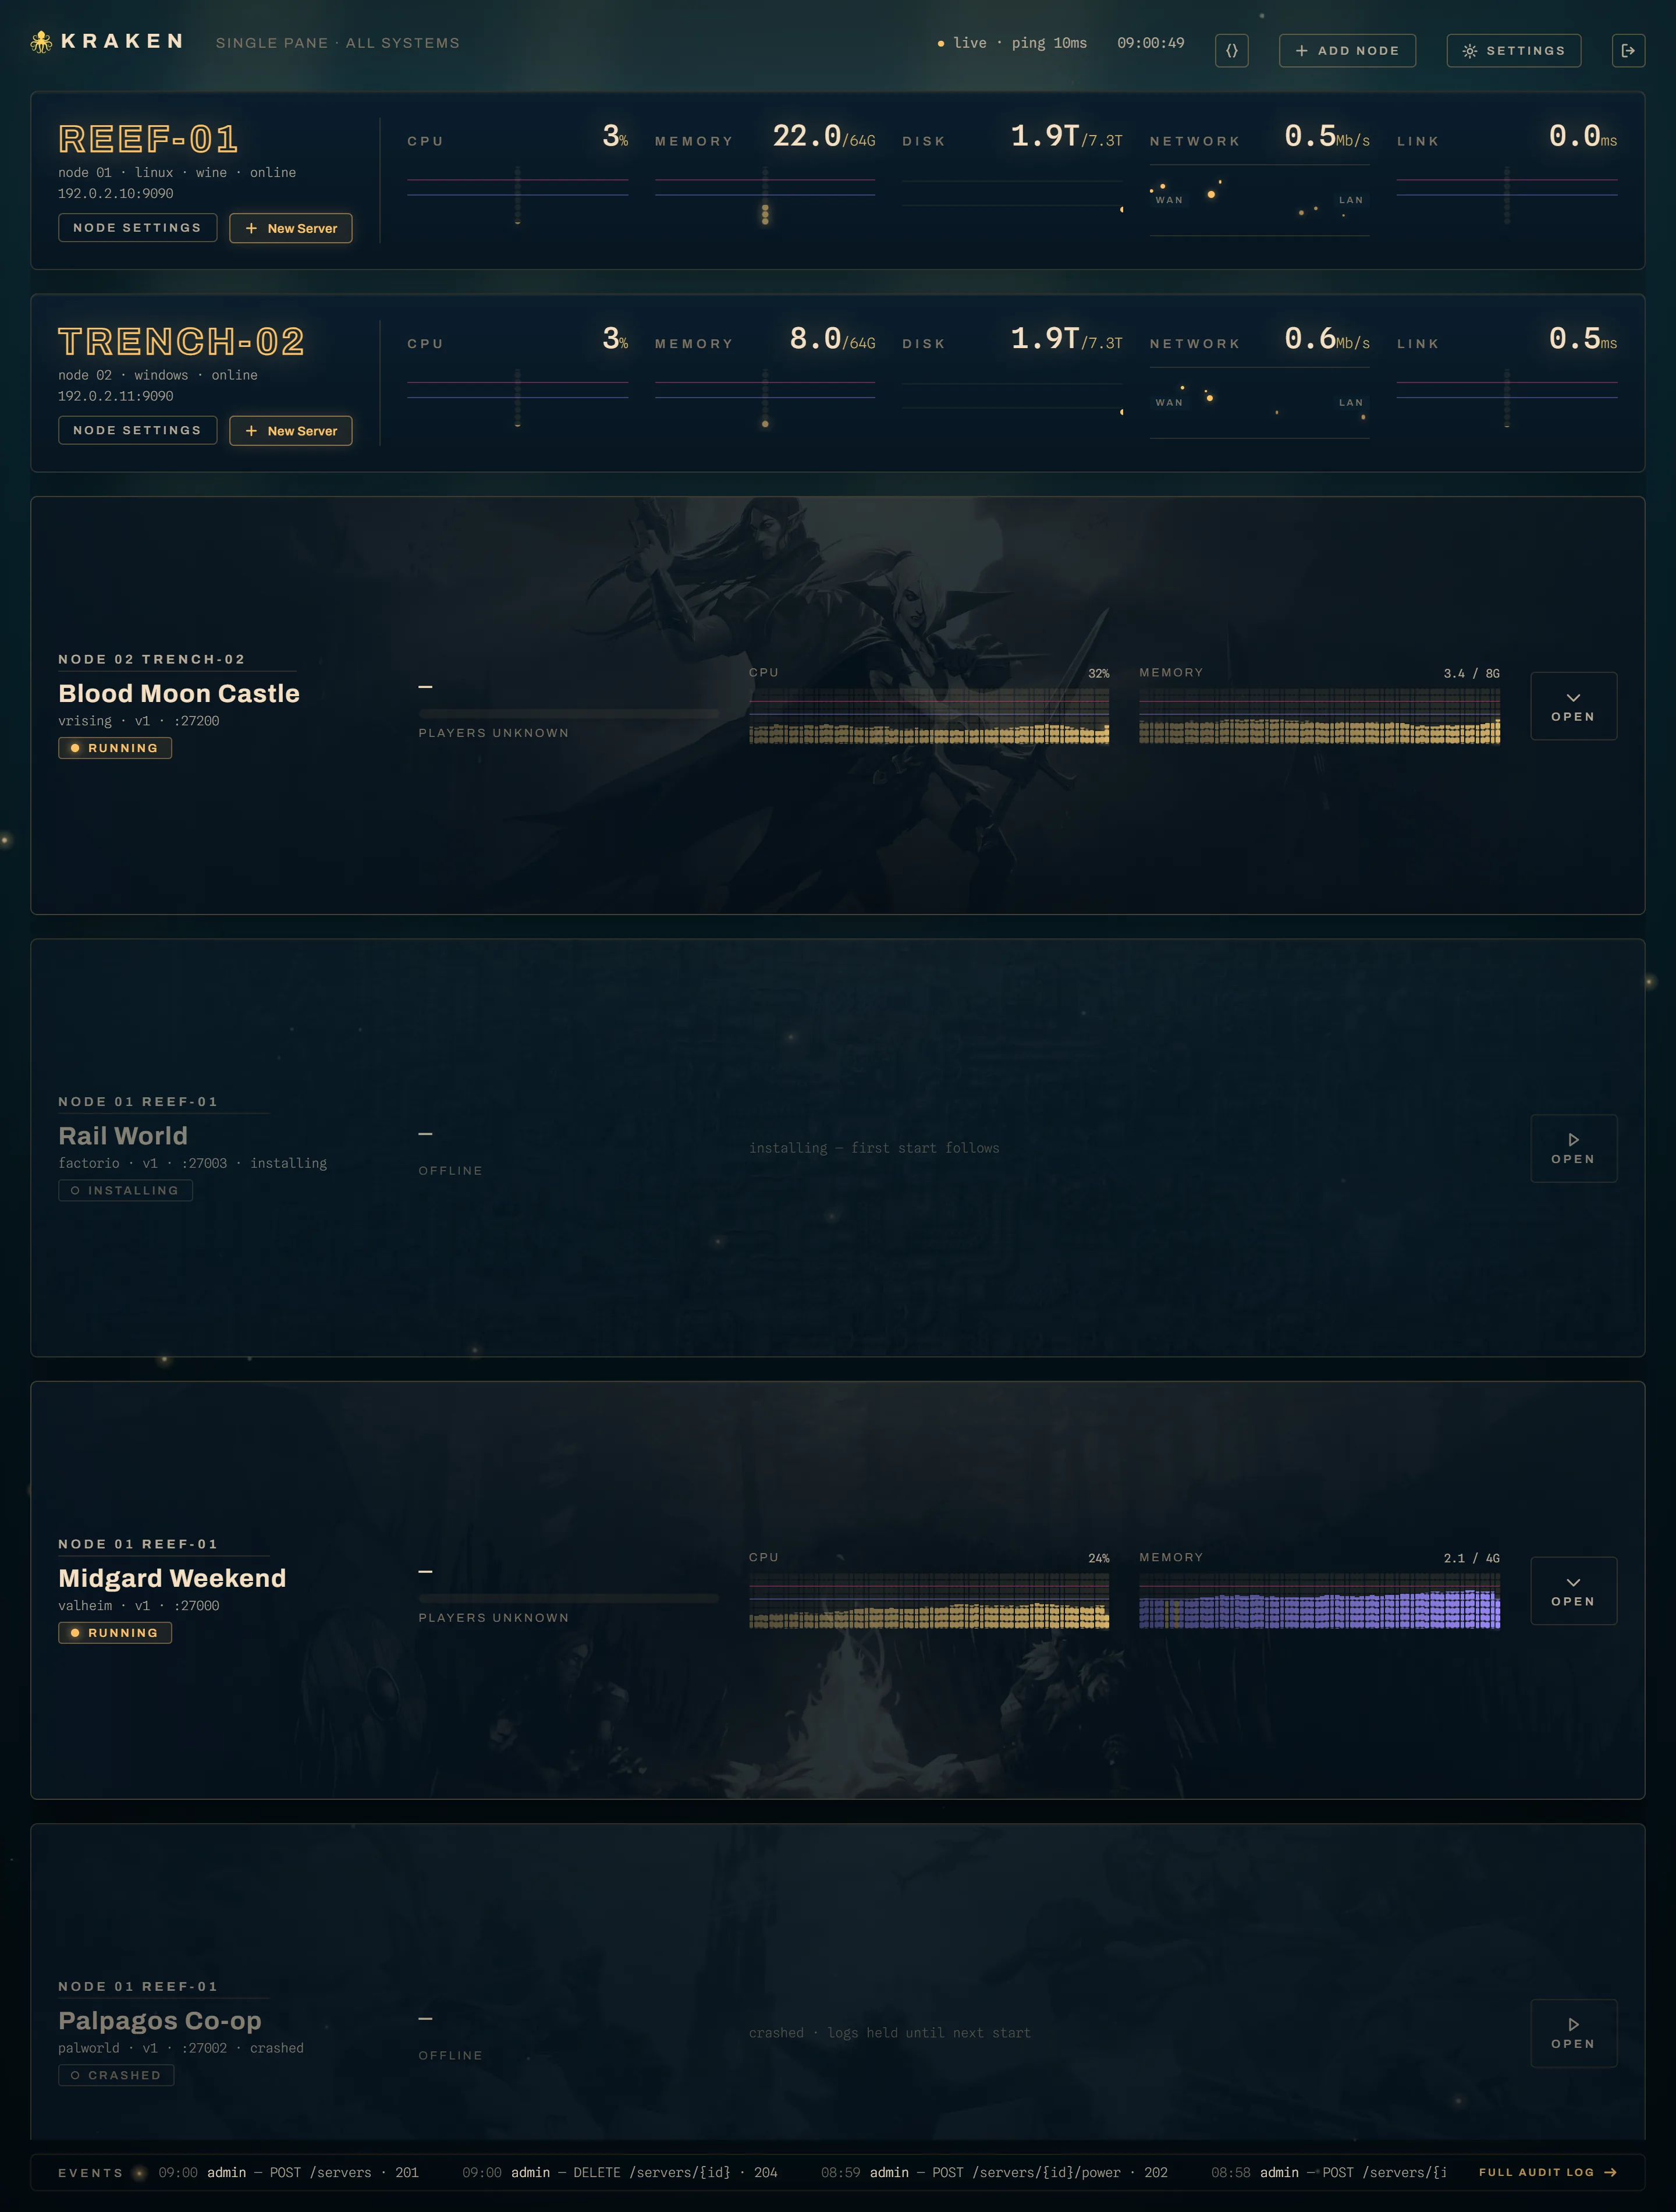
A node band
One band per node, full width, carrying the node's name and five host metrics.
| metric | what it measures |
|---|---|
cpu |
host CPU across all cores, 0 to 100. Blank until the Agent has taken two samples. |
memory |
physical memory in use: total minus available, so reclaimable cache is not counted as used. |
disk |
the filesystem holding the Agent's data directory, not every mount on the box. |
network |
bytes per second across the host's physical interfaces. |
link |
the round trip of the gRPC call that fetched this very reading. |
The rate metrics are sampled by the Agent over its own fixed interval, so they do not skew with how often the Panel asks. The Panel refreshes the telemetry cache every 5 seconds.
link is the one metric that is not about the host. It is the Panel's own
timing of the gRPC round trip, in milliseconds, which makes it the only reading
on the band that measures the relationship rather than the machine. It has no
"known" flag, because the entry existing is the proof that the round trip
happened. The track runs 0 to 20 ms, with its guide marks at 10 and 15, so a
LAN node sits near the floor and a tunnel node on the other side of a
consumer uplink sits visibly higher without that being a fault. I read it as a
weather report, not an alarm: what matters is the shape changing, not the
number.
Three health states, and a fourth that is a decision
| status | what it means | schedulable |
|---|---|---|
online |
the Agent answers and its container runtime answers | yes |
partial |
the Agent answers, its container runtime does not | no |
offline |
the Agent cannot be reached at all | no |
cordoned |
reachable and healthy, deliberately excluded from new placements | no |
partial is the one worth learning before you meet it. The Agent is alive, its
file operations still work, and you can still browse and back up the data
directory. What it cannot do is install, start or observe a container, so the
node is not schedulable, because nothing placed there could start. The runtime's
own error comes back with the status and is shown on the band. An Agent that
starts without Docker comes up this way and promotes itself when Docker appears,
with no restart and no re-enrollment.
cordoned is not a health state at all, it is you saying "not here". It never
masks a real problem: a cordoned node that goes partial or offline reads partial
or offline. The band shows the padlock and keeps printing online on its meta
line, which is the honest reading, since the node is fine and the exclusion is
yours.
The port pool is not on the band. It lives in the node's settings sheet as a
start and an end, and 28000–28999 is the reference range rather than a default
you inherit. Changing the range never touches a running server; ports already
allocated stay reserved. A node with no range registers fine and reads online,
then refuses every deploy with "no node can host this spec" while the fleet
looks healthy, which is a confusing half hour. Set the range when you register
the node.
The container-drift badge
When a node's band reads containers 4 running · 1 untracked, the Panel is
telling you that its own books and the node's disagree, and by how much.
The Agent reports the containers carrying the kraken.managed=true label, and
the Panel compares the live ones (running, paused or restarting) against its
own server rows on that node. From Agent 0.59.0 the report includes stopped
containers too, each with its state (below); an older Agent reports only the
live ones. The drift half of the line appears only when the two accounts differ,
and only for a node that is not offline and has been contacted at least once.
untrackedmeans the node is running more than the Panel expects. Some container is up that no server row accounts for.missingmeans the Panel expects more than the node has. A row saysrunningover a container that is not.
From Agent 0.54.0 the badge names what it counts. The Agent sends the
server id and the container name of every managed container it sees, so the
badge reads containers 4 running · 1 untracked · kraken_9f3c… — up to three
names inline, and the full roll call (container name plus server id) in the
badge's tooltip whatever the number. An older Agent sends only the count, and
the badge falls back to 4 running · 1 untracked with nothing to hover: to get
the names, update the Agent.
Naming the containers also settles what used to be a routine false alarm.
1 untracked during an install or an update pass was normal and transient
on an Agent that only counted: the one-shot install container is named
kraken_<server-id>_install and carries the same managed label the game
container does, quite deliberately, so the Agent's adoption scan and its cleanup
both find it, and while it ran the node had one more managed container than the
Panel had running rows for. An Agent that names its containers reports that
one against the server id it belongs to, the Panel finds the row, and the badge
stays quiet for the length of the pass. From Agent 0.59.0 the install container
is not reported at all, in any state: an exited one left behind after a pass
would otherwise read as the server's stopped game container.
From Agent 0.59.0 the Agent reports stopped containers too, each with the
state Docker gives it. A container is live when it is running, paused or
restarting — it holds memory and ports — and stopped when it is created,
exited, dead or removing. Only live ones count on either side: untracked
is a live container no row accounts for, missing is a running row with no
live container, and N running is the Agent's count of live containers. A
stopped container is neither untracked nor missing — it is what an offline
server keeps for its next start. The line counts them instead,
containers 2 running · 1 stopped, and it stays on the band whenever that
count is above zero, drift or no drift. The count is node-wide; whether one
particular offline server still has its container is what the drill-in says —
its empty console reads installed · no container until start when the node
has none for it, which is what a reinstall or an update pass leaves until
start. An Agent older than 0.59.0 reports only live containers, so there is
no stopped count and no drill-in note until the Agent is updated.
A badge that does not clear is worth acting on. There are two causes, and
the badge tells you which. If a server row exists for the id — it shows
install_failed or offline while players are connected — it is a restart
that failed at the "stop before update" step while the Agent was unreachable.
If no row matches, it is an orphan: a server deleted while its node could
not be told, on a Panel from before that was remembered.
Troubleshooting has both written out.
Retiring an untracked container
Each named untracked container on the line carries a retire chip (past
three, one retire all takes them together). It is offered to a role holding
both server.delete and node.manage, and it asks for a plain confirmation
rather than the typed one, because it destroys nothing:
- the node stops and removes the container, and the install container if one was left behind;
- the Agent forgets the server's persisted spec, so its watchdog never adopts the container again after an Agent restart;
- the server's data directory stays exactly where it is, and its backups are kept.
It is refused with 409 server_tracked if the Panel does have a live server
with that id on that node — retire the server instead — and with
409 removal_pending if a removal is already owed for that id (see below: that
removal may delete the data, so a retire promising otherwise would be undone by
the next retry). A node that is not answering is 503 node_unreachable; one
that answers but cannot remove the container is 500 node_error with its
reason. A refusal lands on the band as retire · <reason> and clears once the
container is gone.
The API is DELETE /api/v1/nodes/{id}/containers/{serverID}.
Pending removals
A retire no longer needs the node to be there, and neither does a permanent
delete. When the Panel cannot reach the node, or its Agent reports that the
removal failed, the retire goes through anyway — the server becomes retired —
and the removal is remembered on the node together with what you asked for
(container and data, and for a permanent delete the server's own archives). The
server's memory and ports stay allocated on the node until the removal
lands, because the container may still be running and bound; they are released
when the node confirms. A retired server does not hold its own removal back,
while a live server row with the same id on that node does — the removal waits
rather than destroy what may be a running game — and a revive is refused until
the removal has landed.
While it is owed, the band reads removals · 1 pending, and the container, if
it is still running, is counted there rather than as untracked. Hover it for the
server id, how many tries it has had and the last failure. The Panel's node
reconciler retries each pending removal while the node answers, backing off
after each failure — 20 seconds, then 40, doubling up to an hour apart — and the
line goes away when the Agent confirms. It never holds up the node health pass:
a node whose removals hang does not delay any other node's status.
If the Panel cannot record the removal at all (its database is failing), the
retire is abandoned (the server says so in retire_note) and a permanent delete
is refused with a 500; nothing is removed either way.
This is your retire or delete, carried out late. The Agent never decides on its own that
a container it finds should go: it adopts what it finds running, as it always
has, and removes only what the Panel tells it to. The same list is on the node
record as pending_removals in GET /api/v1/nodes.
Server cards
Below the bands, one card per server, and clicking one opens the full-screen drill-in where the real instruments live.
A card carries the spec's banner art, the owning node above the server name, and
a metadata line reading spec-slug · vN · :port with the state appended when the
server is not running. The state chip is lit for running and starting and
dim for everything else, which is the house rule that a stopped thing loses its
light rather than being painted as a crisis.
A running card adds the player readout with its occupancy rail: n / max,
labelled players online, or an em dash and players unknown when the game has
no query support or the count has not arrived yet. The card's cpu and memory
tracks are motion rather than measurement; real per-server numbers exist only on
the drill-in's live WebSocket, and I would rather the card animate than invent a
number for a chart.
A stopped card says why in one line:
| line | what happened |
|---|---|
installing — first start follows |
the install is running; the server starts itself when it lands |
install failed · <reason> |
the install pass failed and left the reason |
crashed · logs held until next start |
the process exited unexpectedly |
stopped · world saved on shutdown |
you stopped it |
live, or stale
The header carries a dot and one of two readings: live · ping Nms, or stale
with the age of the last good answer.
The fleet polls on a chained timer rather than a fixed interval, and re-decides
the gap after every tick. At rest it is 10 seconds. While any server is in a
transient state — installing, starting or stopping — it tightens to 2.5
seconds, because those are exactly the moments you are watching the screen
waiting for something to change.
The header flips to stale after three missed polls, which is 30 seconds. The clock is anchored to the resting interval rather than the transient one on purpose: the threshold should mean the same thing whatever the page happens to be doing. The age only restarts when every read in a tick succeeded, so a poll that half-worked does not reset it, and the last error is on the mark's tooltip.