Every request that changes something is written to the audit log in Postgres. Reads are not, deliberately: a log where a page refresh is the most common entry is a log nobody reads.
What a row holds
| field | what it is |
|---|---|
time |
when the request was handled |
actor |
the username, or anonymous for a pre-authentication event |
action |
the method plus the route pattern, plus a detail when the handler added one |
method · path |
the HTTP method and the path as requested |
target_type · target_id |
server, node, spec, user or auth, and the {id} from the route |
status |
the response status the request actually ended on |
ip |
the resolved client address |
forwarded_for |
the raw X-Forwarded-For as received — only when ip identifies nobody, and never trusted |
The action field uses the route pattern, not the concrete path, so rows
group: POST /servers/{id}/power is one action whichever server it was, and the
id is in target_id where it belongs.
GET, HEAD and OPTIONS never write a row. Three routes that sit outside the
authenticated group audit themselves instead, because they have something worth
recording and no session to attribute it to: login, Agent enrollment, and the
loopback local-enroll on first run.
The colour rule
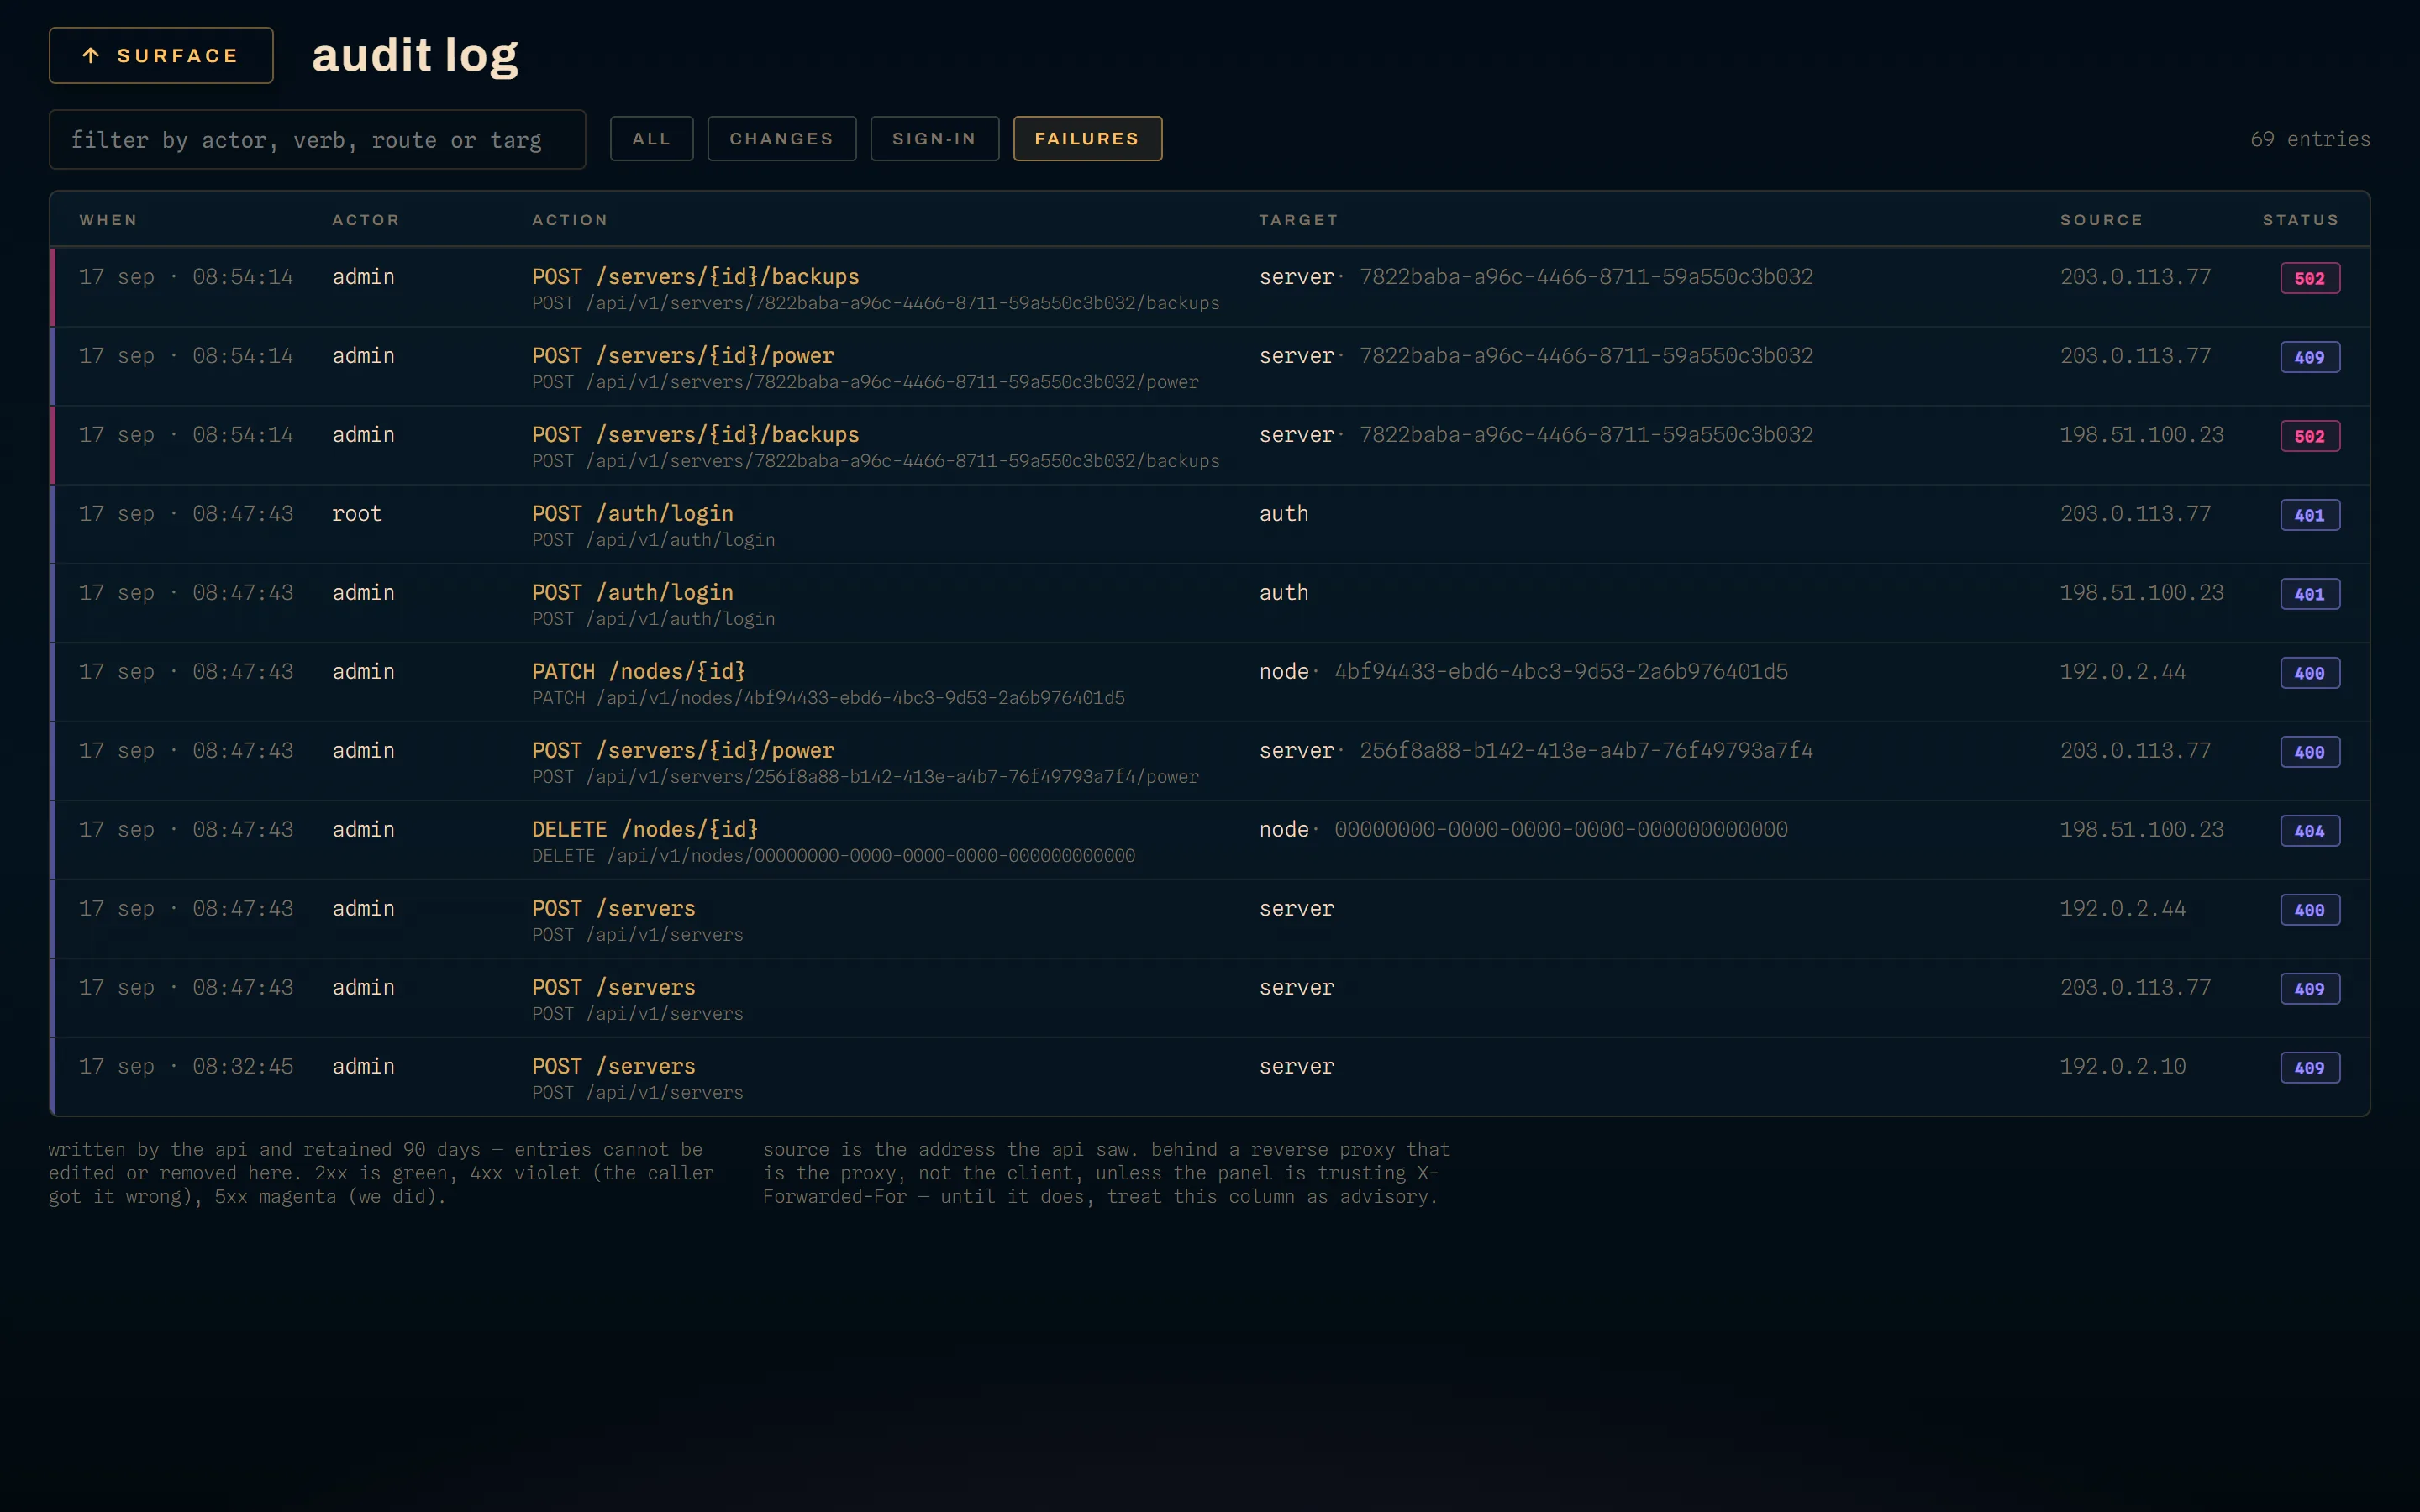
A status is coloured by its family, never by a verdict the UI invents:
- 2xx takes the status gold.
- 4xx takes caution violet. The caller got it wrong.
- 5xx takes crisis magenta. We did.
A 4xx is never painted crisis, because a mistyped password is not an outage. It is a small rule and it does a lot of work on a filtered view: a screen of violet is somebody fumbling, a screen of magenta is something to go and fix.
Download tokens leave two rows
A tokenised file download writes a mint row and a redemption row:
POST /servers/{id}/files/download-token — mint download token (zip, 3 paths)GET /servers/{id}/files/raw — download token redeemed (raw, 1 path)
The path count, not the paths. The token itself appears in no log line at
all. A redemption that was refused reads download token refused (…), because
the row carries the request's real outcome rather than an assumed 200: a
download the node could not serve is on the record with the status it got — a
404 for a file that is not there, a 409 for one another process holds, a 503
when the node could not be reached.
A redemption rejected before it got that far, an expired or forged token, is
not an audit row. It is a Debug log line and a counter,
kraken_download_tokens_rejected_total, so an unauthenticated caller with a bad
token cannot amplify writes into the audit table. Turn KRAKEN_LOG_LEVEL to
debug when you want to watch them.
Rate limiting leaves one row per window
A login refused by the rate limiter never reaches the handler that would audit a failed attempt, so the limiter writes the row itself. Two limiters guard that route, on different keys, and each leaves its own row:
POST /auth/login — rate limited (too many attempts from this address)
as anonymous, when one client address has exhausted its twenty a minute, and
POST /auth/login — rate limited (too many failed attempts for this username)
as the username, when one account has taken ten failed guesses in a minute. The
second one is the finding: this account is being worked on. It is written even
when the Panel cannot tell one caller from another, which is the whole reason
that limiter exists. POST /auth/change-password writes the same row when the
current password is fumbled past the same budget.
Either row is written once per key per window rather than once per request. That is the difference between a signal and a flood: somebody hammering login produces one row a minute, not one row a request.
Reading the source column
ip is whatever the Panel resolved the client to be, and the default is the
real TCP peer with no forwarding header believed at all.
Behind a reverse proxy or a Cloudflare Tunnel, that default is wrong, and it
is wrong in a way that looks like it is working: the peer is the proxy on every
request, so every row records the proxy. The same resolution feeds both rate
limiters, which collapse into one shared bucket a single stranger can exhaust
for everybody, and the /setup/* internal-network gate, which then sees a
loopback address for the entire internet.
Name your proxy's CIDR in KRAKEN_TRUSTED_PROXIES and the Panel takes the
rightmost X-Forwarded-For hop that is not itself trusted. Rightmost, because
the list is appended hop by hop and only what a trusted proxy appended can be
believed. X-Forwarded-For is the only header consulted; CF-Connecting-IP
looks more direct and is not, since every proxy other than Cloudflare passes a
client-supplied one through untouched.
An entry that does not parse is a startup error, not a warning, for exactly this reason: a typo that silently emptied the list would leave you with a Panel that looks fine and an audit log that records nothing useful.
The whole configuration, with the working examples, is on behind a reverse proxy.
when the address identifies nobody
Some topologies cannot be fixed by naming a proxy — Docker Desktop rewrites the
source of every published-port connection to its own gateway, and the real
address is gone before the Panel sees a byte. For those rows the Panel keeps the
raw X-Forwarded-For chain alongside the resolved address, and the audit log
marks the source cell · fwd with the chain on hover. It does this only when
the resolved address is private or is one you exempted with
KRAKEN_RATE_LIMIT_IP_SKIP; a row with a real client address does not need it.
Read it as forensics, never as proof. The caller wrote that header. Behind Cloudflare → a proxy → a published port it is where the visitor's true address survives and the one place you can go looking for it, but nothing in the Panel resolves to it, limits on it or gates anything behind it, and neither should you.
How long entries are kept
The Panel keeps 90 days by default and deletes what is older:
KRAKEN_AUDIT_RETENTION_DAYS=90 # 0 keeps every entry foreverA background job runs the sweep a minute after startup and every 24 hours after that. It deletes in batches of 5000 rather than in one statement, so a log that has been accumulating since the Panel was installed is drained over a few short deletes instead of one long lock held against the audit writes still arriving. A pass that removed something logs a single line with the count; a pass that found nothing says nothing.
Set the window to 0 when something else owns retention — an external log
shipper, or a compliance rule that says the trail outlives the database's
convenience. Nothing is deleted then, and the console says retained indefinitely instead of naming a window.
The value has to be a whole number of days, 0 or more. Anything else stops the
Panel at startup: deletion is not recoverable, and a Panel that fell back to the
default after a typo would be pruning on a schedule nobody chose.
Getting at it
GET /api/v1/audit returns the most recent entries, newest first, and needs the
audit.view permission, which Owner and Admin hold. The response also carries
retention_days, which is where the console's footnote gets its number — the
screen quotes what the Panel is actually keeping to rather than a figure typed
into the copy.